Example 12: Rising bubble
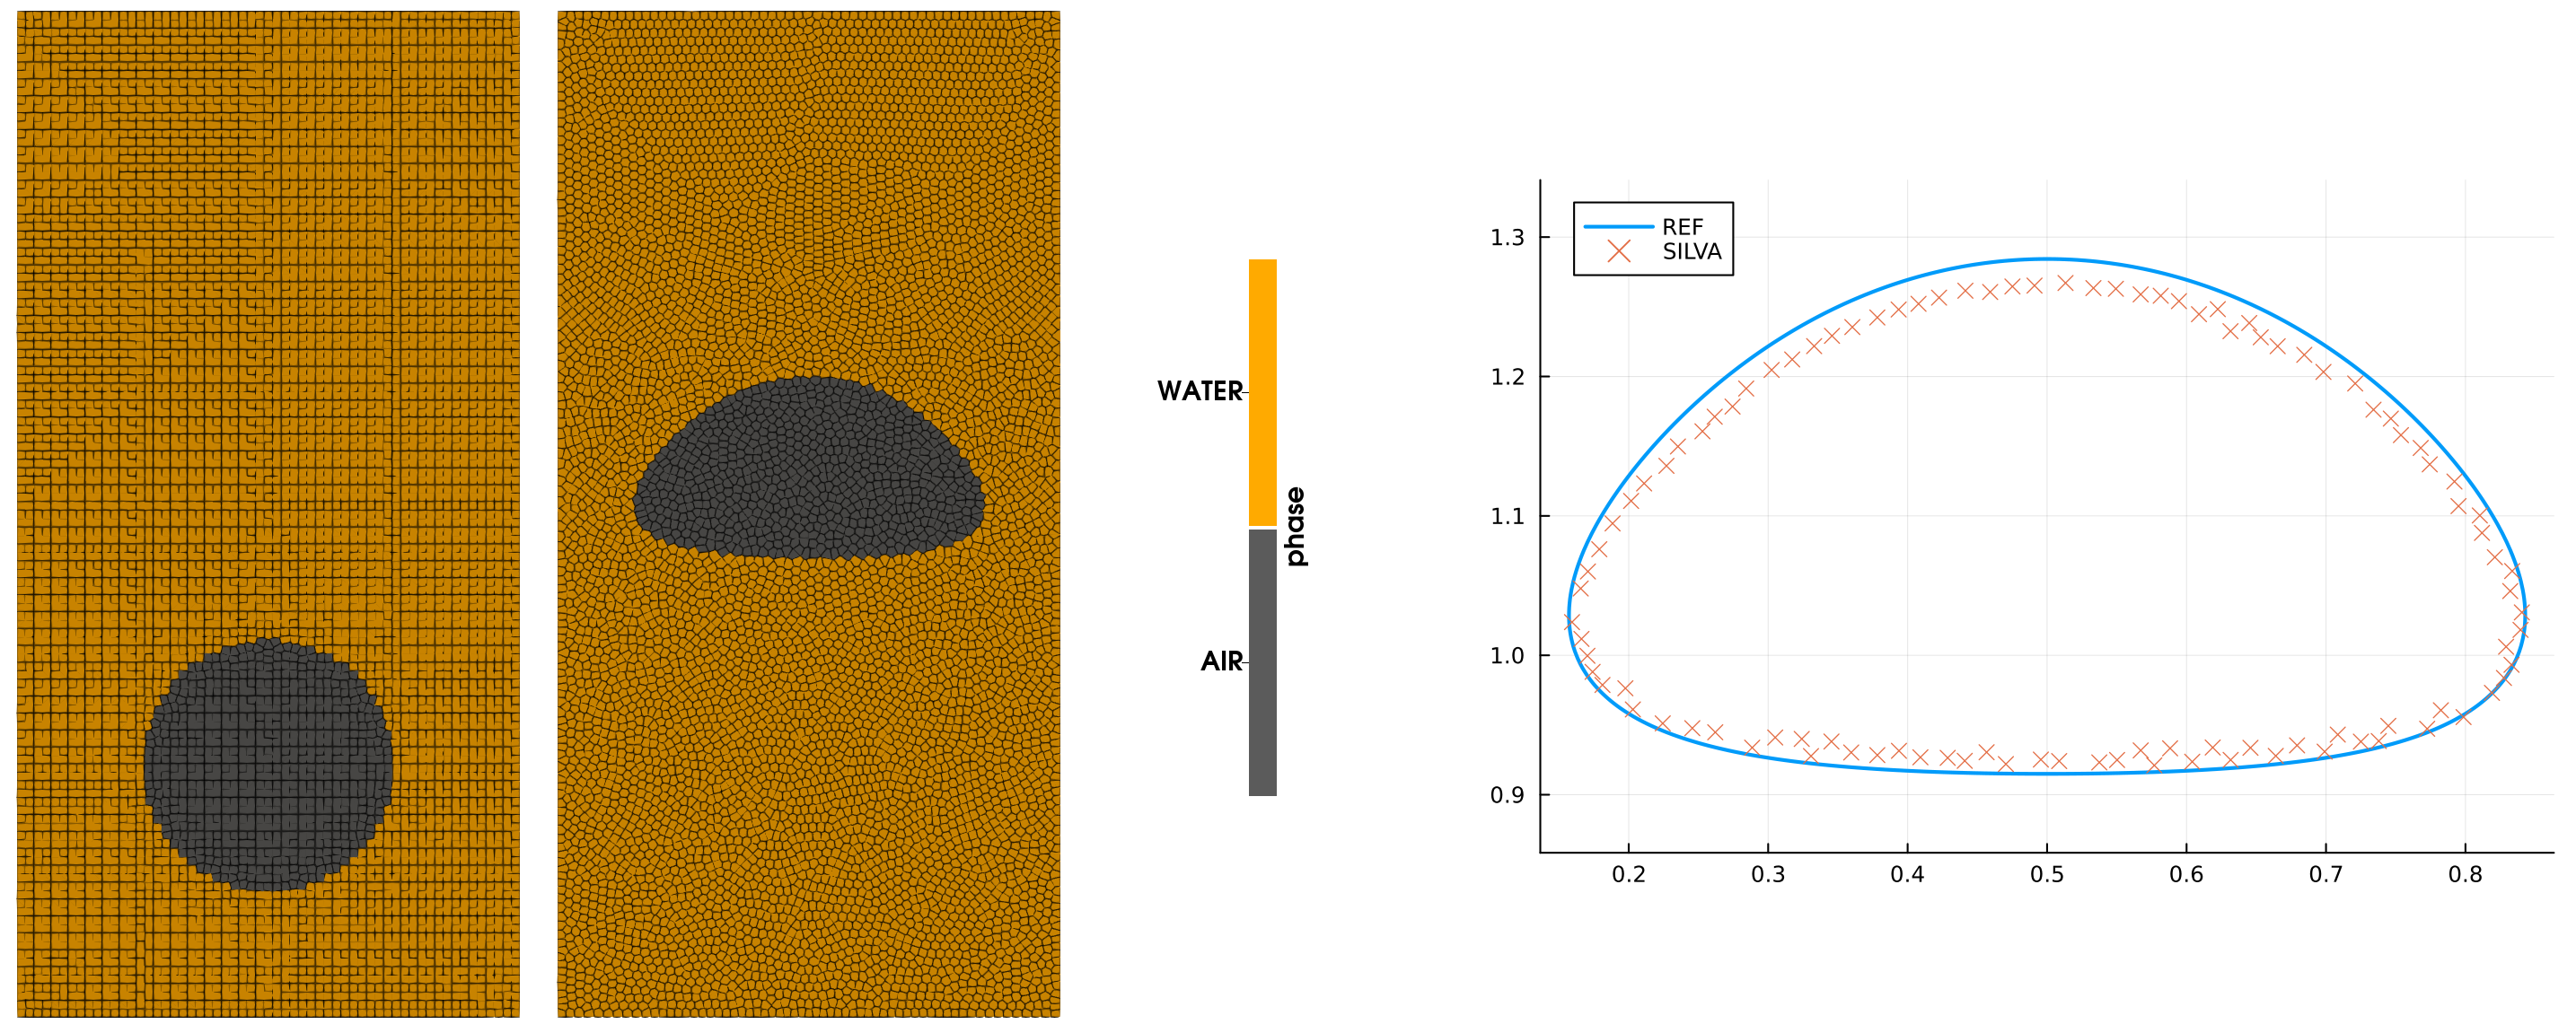
An air bubble rising due to buoyancy. Outputs of the simulation are
- bubble center of mass (y-coordinate)
- the rising speed
- the shape at $t=3$
The result is compared to a reference solution. Find details in this excellent overview.
module bubble

include("../src/LagrangianVoronoi.jl")
using .LagrangianVoronoi

using StaticArrays
using Plots
using Parameters
using Base.Threads
using WriteVTK
using LinearAlgebra
using Polyester
using LaTeXStrings, CSV, DataFrames

const R = 0.25
const Rho = 1000.0
const rho = 100.0
const Mu = 10.0
const mu = 1.0
const dr = R/15
const v_char = 1.25
const dt = 0.1*dr/v_char
const t_end = 3.0
const nframes = 100
const g = 0.98
const st = 24.5
const smoothing_length = 3dr


const export_path = "results/bubble"
const xlims = (0.0, 1.0)
const ylims = (0.0, 2.0)


const WATER = 0
const AIR = 1

function ic!(p::VoronoiPolygon)
    p.c2 = Inf
    r = sqrt((p.x[1]-0.5)^2 + (p.x[2]-0.5)^2)
    p.phase = (r < R) ? AIR : WATER
    p.rho = (p.phase == WATER ? Rho : rho)
    p.mu = (p.phase == WATER ? Mu : mu)
    p.mass = p.rho*area(p)
    p.v = VEC0
    p.st = st
end

mutable struct Simulation <: SimulationWorkspace
    grid::GridMulti
    solver::PressureSolver{PolygonMulti}
    viscous_solver::ViscousSolver{PolygonMulti}
    bubble_y::Float64 # y-coordinate of the bubble centroid
    bubble_vy::Float64 # bubble rising speed
    Simulation() = begin
        domain = Rectangle(xlims = xlims, ylims = ylims)
        grid = GridMulti(domain, dr)
        populate_rect!(grid, ic! = ic!)
        solver = PressureSolver(grid)
        viscous_solver = ViscousSolver(grid)
        return new(grid, solver, viscous_solver, 0.0, 0.0)
    end
end

function top_and_bottom(x::RealVector)::Bool
    return isapprox(x[2], ylims[1]) || isapprox(x[2], ylims[2])
end

function vDirichlet(_::RealVector)::RealVector
    return VEC0
end

function step!(sim::Simulation, t::Float64)
    move!(sim.grid, dt)
    find_rho!(sim.grid)
    viscous_step!(sim.viscous_solver, dt)
    bdary_friction!(sim.grid, vDirichlet, dt, charfun=top_and_bottom)
    gravity_step!(sim.grid, -g*VECY, dt)
    surface_tension!(sim.grid, dt, smoothing_length)
    find_pressure!(sim.solver, dt)
    pressure_step!(sim.grid, dt)
    phase_preserving_remapping!(sim.grid, dt, smoothing_length)
end

function postproc!(sim::Simulation, t::Float64)
    sim.bubble_y = 0.0
    sim.bubble_vy = 0.0
    bubble_area = 0.0
    for p in sim.grid.polygons
        if p.phase != AIR continue end
        A = area(p)
        bubble_area += A
        sim.bubble_y += A*p.x[2]
        sim.bubble_vy += A*p.v[2]
    end
    sim.bubble_y /= bubble_area
    sim.bubble_vy /= bubble_area
    @show t
    println("y = $(sim.bubble_y)")
    println("v = $(sim.bubble_vy)")
    println()
end


function main()
    sim = Simulation()
    run!(sim, dt, t_end, step!;
        path = export_path,
        postproc! = postproc!,
        vtp_vars = (:v, :P, :rho, :phase),
        nframes = nframes,
        save_points = true,
        save_csv = true,
        csv_vars = (:bubble_y, :bubble_vy)
    )
    export_shape(sim.grid)
    make_plots()
end

function export_shape(grid::VoronoiGrid)
    path = joinpath(export_path, "shape.csv")
    x = Float64[]
    y = Float64[]
    for p in grid.polygons
        if p.phase != AIR continue end
        if !isinterface(p, grid) continue end
        push!(x, p.x[1])
        push!(y, p.x[2])
    end
    shape_data = DataFrame(x = x, y = y)
    CSV.write(path, shape_data)
end

function make_plots()
shape-comparison graph
    shape = CSV.read(joinpath(export_path, "shape.csv"), DataFrame)
    shape_ref = CSV.read("reference/bubble_shape.csv", DataFrame)
    plt = plot(shape_ref.x, shape_ref.y, axis_ratio = 1, label = "REF", linewidth=2)
    scatter!(plt, shape.x, shape.y, markershape = :xcross, markersize = 4, label = "SILVA")
    savefig(plt, joinpath(export_path, "shape.pdf"))

    quantities = CSV.read(joinpath(export_path, "simdata.csv"), DataFrame)
    quantities_ref = CSV.read("reference/bubble_quantities.csv", DataFrame)
center of mass plot
    plt = plot(quantities.time, quantities.bubble_y, label = "SILVA", xlabel = L"t", ylabel = L"y", linewidth=2)
    plot!(plt, quantities_ref.t, quantities_ref.y, label = "REF", linewidth = 2)
    savefig(plt, joinpath(export_path, "bubble_y.pdf"))
rise speed plot
    plt = plot(quantities.time, quantities.bubble_vy, label = "SILVA", xlabel = L"t", ylabel = L"v_y", linewidth=2)
    plot!(plt, quantities_ref.t, quantities_ref.vy, label = "REF", linewidth = 2)
    savefig(plt, joinpath(export_path, "bubble_vy.pdf"))
end

end
This page was generated using Literate.jl.