Example 10: Dam break
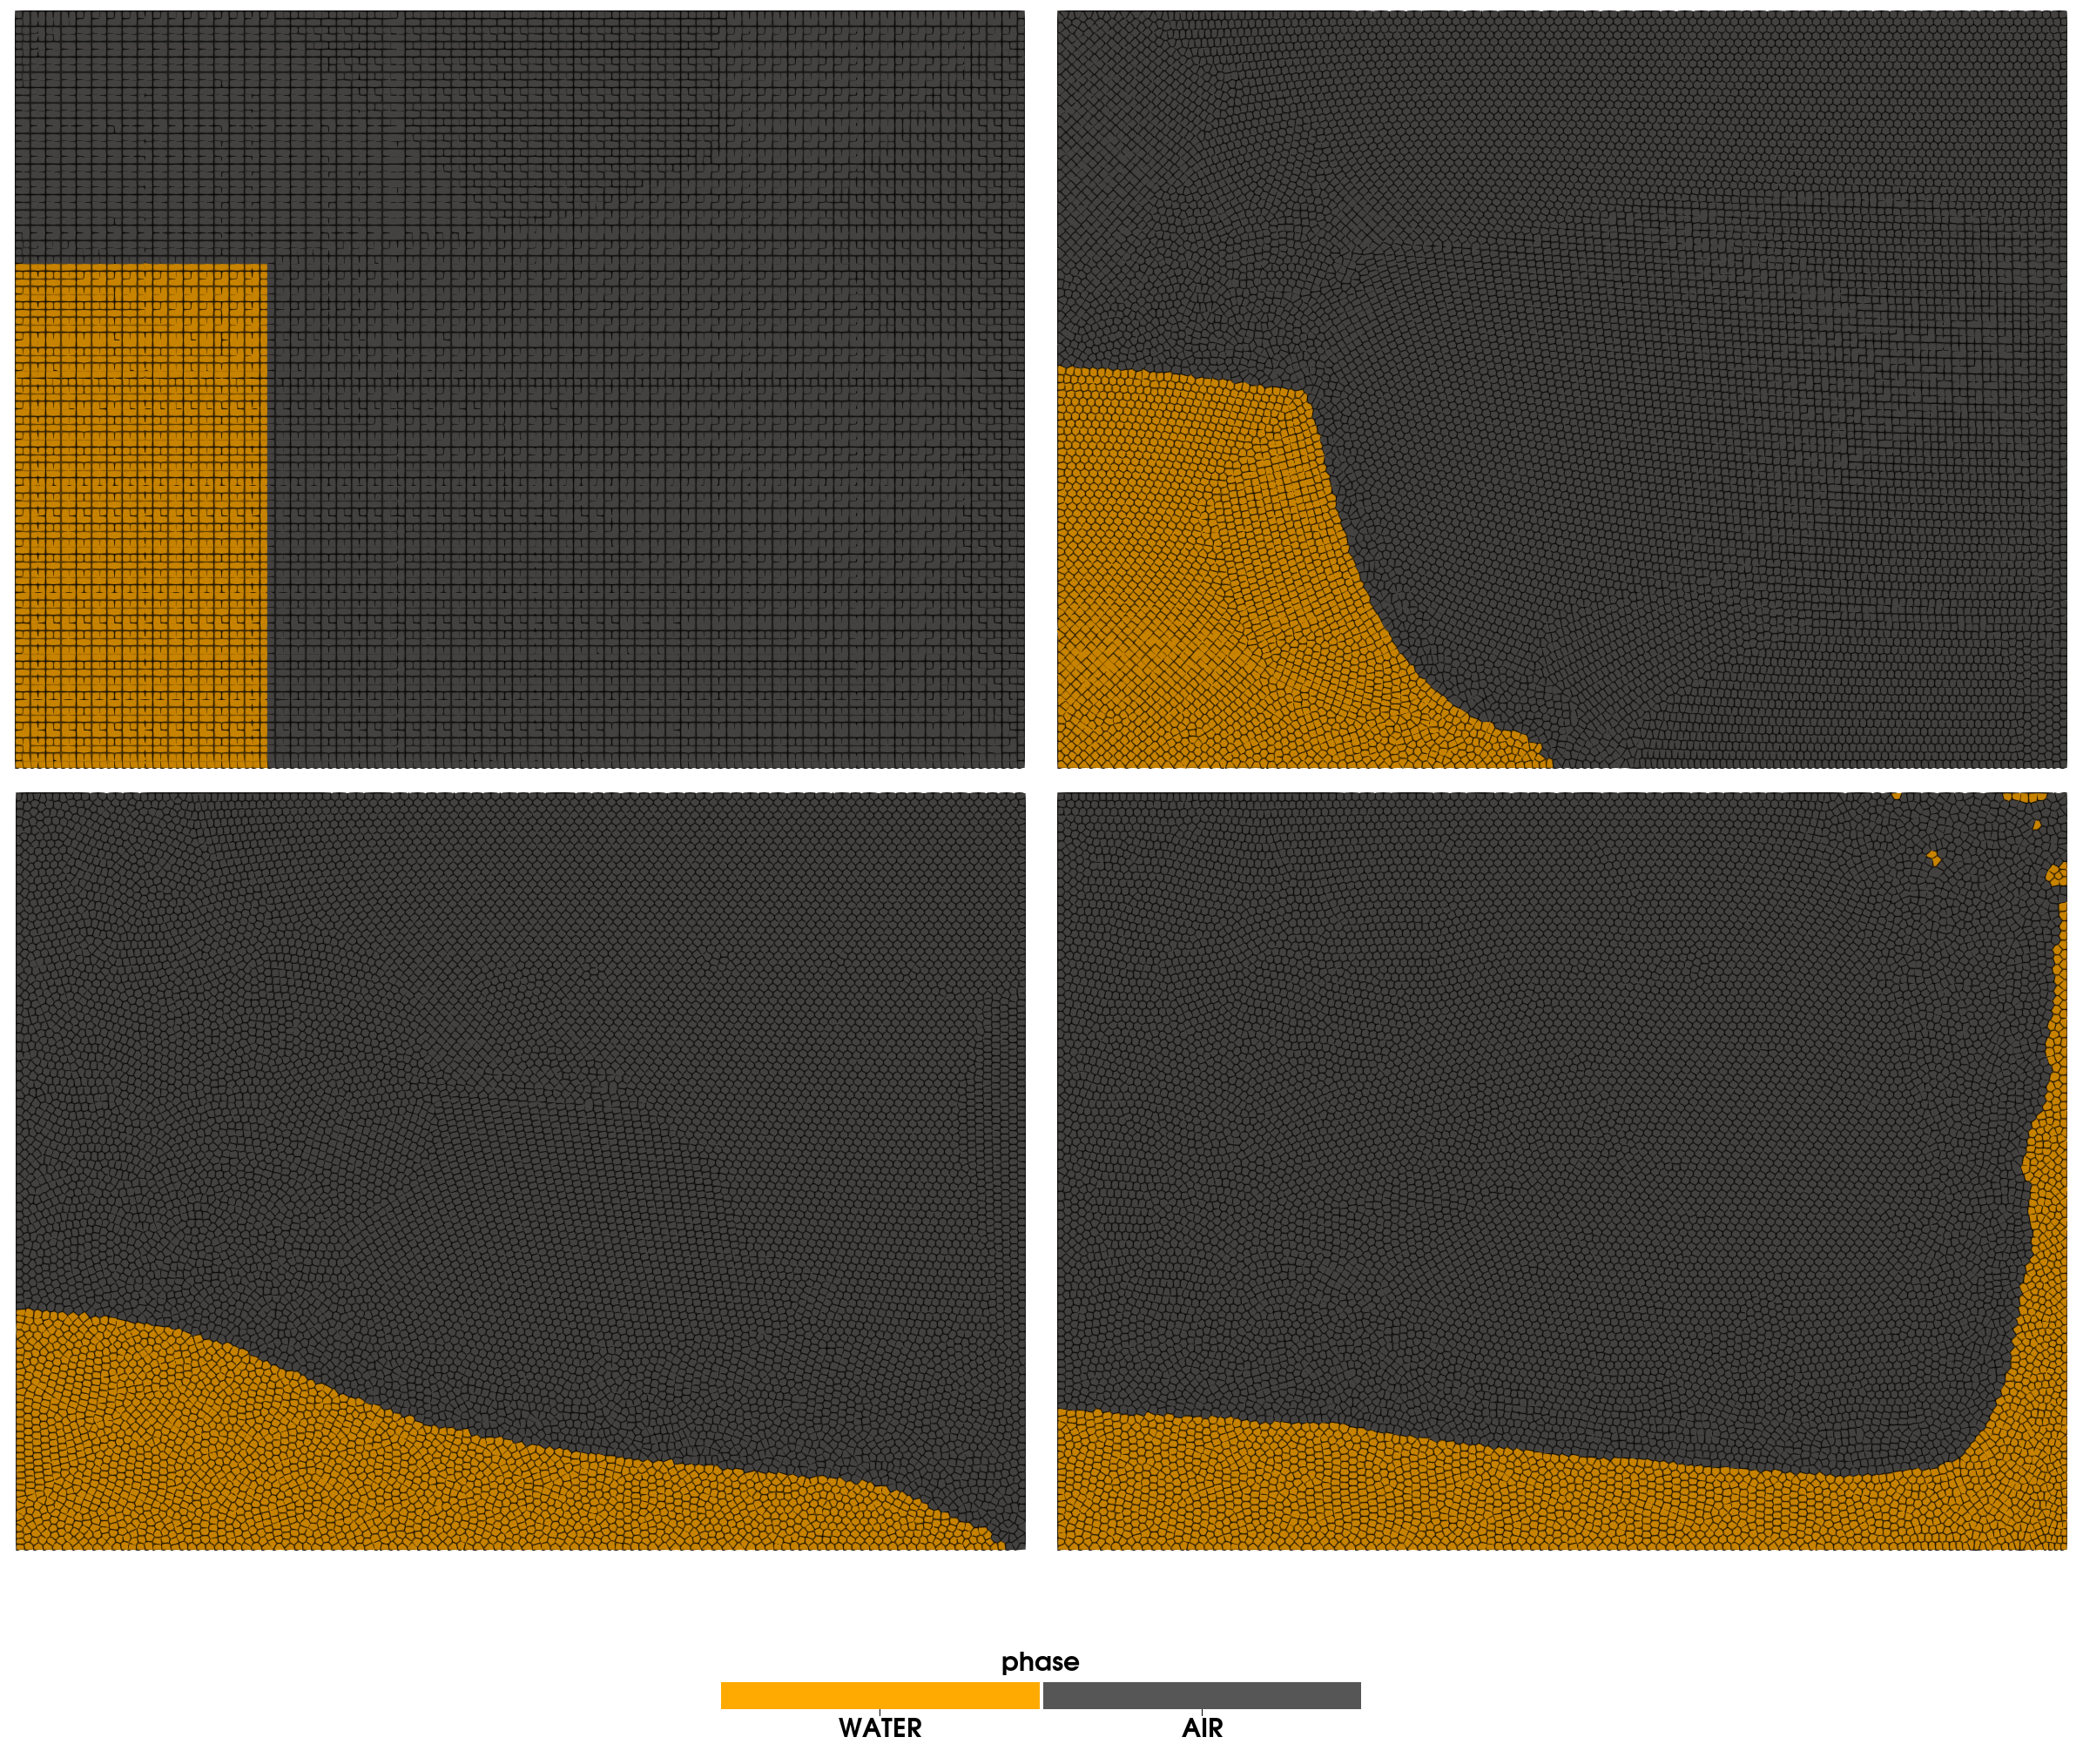
We follow with a dam break test, where a column of fluid collapses under its weight in uniform gravitational field. This is typically simulated by a free surface code, but a multiphase approach is more realistic (it does not have those vanishing air pockets). It is possible to extract numeric data from this test (the x-coordinate of the wavefront and the height of the water column) and compare them to a reference solution or experiment.
module dambreak
include("../src/LagrangianVoronoi.jl")
using .LagrangianVoronoi

using StaticArrays
using Plots
using Parameters
using Base.Threads
using WriteVTK
using LinearAlgebra
using Polyester
using SmoothedParticles:wendland2
using CSV, DataFrames

# physical
const dr = 0.03
const Rho = 1000.0   	  # water density
const rho = 1.25          # air density
const g = 9.8             # gravitational acceleration
const Mu = 8.9e-4         # dynamic viscosity of water
const mu = 3.7e-5         # dynamic viscosity of air
const smoothing_length = 3dr

# geometrical
const water_column_width = 1.0
const water_column_height = 2.0
const box_height = 3.0
const box_width = 4.0
const xlims = (0.0, box_width)
const ylims = (0.0, box_height)

# temporal
const v_char = 15.0
const dt = 0.1*dr/v_char
const t_end = 1.0
const nframes = 200
const export_path = "results/dambreak"

const WATER = 0
const AIR = 1

function iswater(x::RealVector)::Bool
    return (x[1] < water_column_width) && (x[2] < water_column_height)
end

function ic!(p::VoronoiPolygon)
    p.phase = (iswater(p.x) ? WATER : AIR)
    p.rho = (p.phase == WATER ? Rho : rho)
    p.c2 = 100.0^2
    p.mass = p.rho*area(p)
    p.mu = (p.phase == WATER ? Mu : mu)
end

mutable struct Simulation <: SimulationWorkspace
    grid::GridNS
    solver::PressureSolver
    viscous_solver::ViscousSolver
    E::Float64
    momX::Float64 # the total x momentum
    momY::Float64 # the total y momentum
    X::Float64    # x-coordinate of wavefront (dimensionless)
    H::Float64    # height of the water column (dimensionless)
    t_char::Float64
    Simulation() = begin
        domain = Rectangle(xlims = xlims, ylims = ylims)
        grid = GridNS(domain, dr)
        populate_rect!(grid, ic! = ic!)
        return new(
            grid,
            PressureSolver(grid, verbose=false),
            ViscousSolver(grid),
            0.0, 0.0, 0.0,
            0.0, 0.0, 0.0
        )
    end
end

function step!(sim::Simulation, t::Float64)
    move!(sim.grid, dt)
    find_rho!(sim.grid)
    viscous_step!(sim.viscous_solver, dt)
    gravity_step!(sim.grid, -g*VECY, dt)
    find_pressure!(sim.solver, dt)
    pressure_step!(sim.grid, dt)
    phase_preserving_remapping!(sim.grid, dt, smoothing_length)
end

function postproc!(sim::Simulation, t::Float64)
    sim.E = 0.0
    sim.momX = 0.0
    sim.momY = 0.0
    sim.X = -Inf
    sim.H = -Inf
    sim.t_char = t*sqrt(2g/water_column_width)
    for p in sim.grid.polygons
        if p.phase == WATER
            sim.E += 0.5*p.mass*norm_squared(p.v) + p.mass*g*p.x[2]
            sim.momX += p.mass*p.v[1]
            sim.momY += p.mass*p.v[2]
			sim.X = max(sim.X, p.x[1]/water_column_width)
			sim.H = max(sim.H, p.x[2]/water_column_height)
        end
    end
    percent = round(100*t/t_end, digits = 5)
    println("t = $t ($(percent)%)")
    println("energy = $(sim.E)")
    println("momX = $(sim.momX)")
    println("momY = $(sim.momY)")
    @show sim.X
    @show sim.H
    println()
end

function main()
    sim = Simulation()
    run!(sim, dt, t_end, step!,
        path = export_path,
        vtp_vars = (:rho, :P, :v, :phase),
        csv_vars = (:X, :H, :t_char),
        save_points = true,
        postproc! = postproc!,
        nframes = nframes
    )
    make_plot()
end

function make_plot()
	data = CSV.read(export_path*"/simdata.csv", DataFrame)
	X_VIO = CSV.read("reference/dambreak_X_Violeau.csv", DataFrame)
	X_KOS = CSV.read("reference/dambreak_X_Koshizuka.csv", DataFrame)
	H_VIO = CSV.read("reference/dambreak_H_Violeau.csv", DataFrame)
	H_KOS = CSV.read("reference/dambreak_H_Koshizuka.csv", DataFrame)
	p1 = plot(data.t_char, data.X, label = "Voronoi", xlims = (0., 3.0))
	scatter!(p1, X_VIO.time, X_VIO.X, label = "SPH")
	scatter!(p1, X_KOS.time, X_KOS.X, label = "Koshizuka&Oda", markershape = :square)
	savefig(p1, export_path*"/dambreak_X.pdf")
	p2 = plot(data.t_char, data.H, label = "Voronoi", xlims = (0., 3.0))
	scatter!(p2, H_VIO.time, H_VIO.H, label = "SPH")
	scatter!(p2, H_KOS.time, H_KOS.H, label = "Koshizuka&Oda", markershape = :square)
	savefig(p2, export_path*"/dambreak_H.pdf")
end

if abspath(PROGRAM_FILE) == @__FILE__
    main()
end

end
This page was generated using Literate.jl.